
Standard Calibration
A standard ECG is recorded at 25mm/sec and with a frequency cut off of no lower than 150Hz in adults, and 250Hz in children.
On the standard ECG paper, with standard calibration, the squares represent:
 The standard calibration signal will look like this:

This will be present at the beginning or end of all four rows of the trace, and shows:
- Speed = 25mm/sec
- VLimb Leads = 10mm/mV
- VChest Leads = 10mm/mV
Alterations to calibration can be made for a number of reasons.
I personally have gained traces with overlapping QRS complexes in the Precordial leads. In order to analyse the ECG, reducing the voltage in the overlapping leads was necessary. Halving the voltage in leads V1- V6 will show:

This implies the VChest Leads = 5mm/mV. Halving all leads would remove the “top step” on the signal, creating a level one at 5mm.
Waves
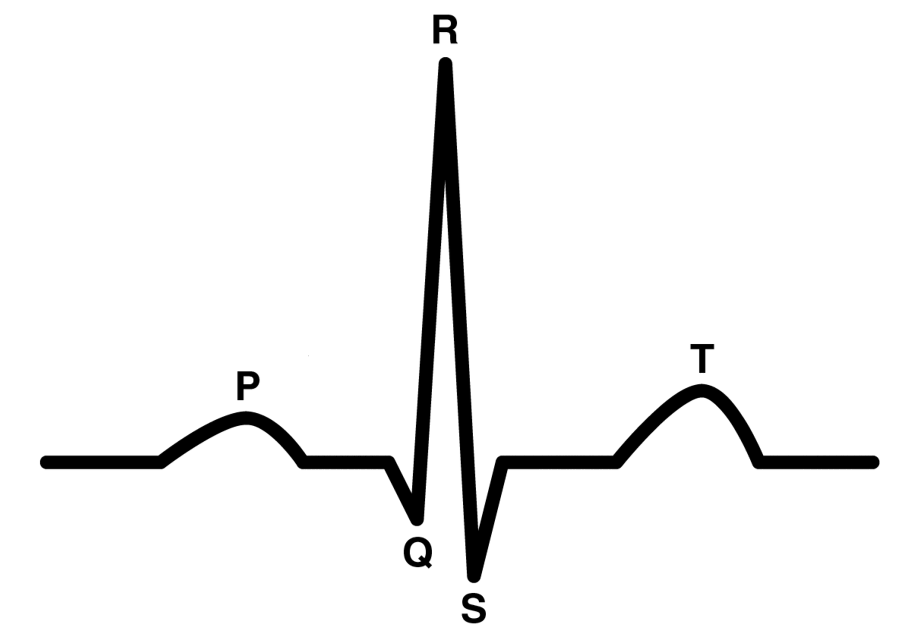
A regular waveform looks something like the above. It is important to note the existence of the U wave (not present in this image), which is sometimes seen after the T wave.
Connecting these individual waves further, are the segments and intervals. The complete PQRST(U) makes up a depolarisation-repolarisation cycle:

")
- P Wave
- Spread of electrical impulse across atria from SA node
- Atrial depolarisation
- QRS Complex
- Spread of electrical impulse through the ventricles
- Ventricular depolarisation
- T Wave
- Ventricular repolarisation
- PR Interval
- Electrical impulse spreads over atrium, through AV node and Bundle of His
- ST Segment
- Isoelectric point. No change in electrical activity
- QT Interval
- Depolarisation and repolarisation of the ventricles
- U Wave
- Hypothesised to be Purkinje repolarisation
Heart Rate
- Count the number of small squares between two R waves
- Divide by 1500
Worked example

- 20 small squares between first and second R waves
- 1500/20 = 75
- Heart rate = 75bpm
QT Correction
A corrected QT interval estimates the QT at a heart rate of 60bpm to allow comparison of values over different heart rates
There are a number of ways to calculate the QTc depending on the actual HR of the patient:
- Bazett’s Formula (HR 60-100bpm)

- Federicia’s Formula (HR <60 & >100)

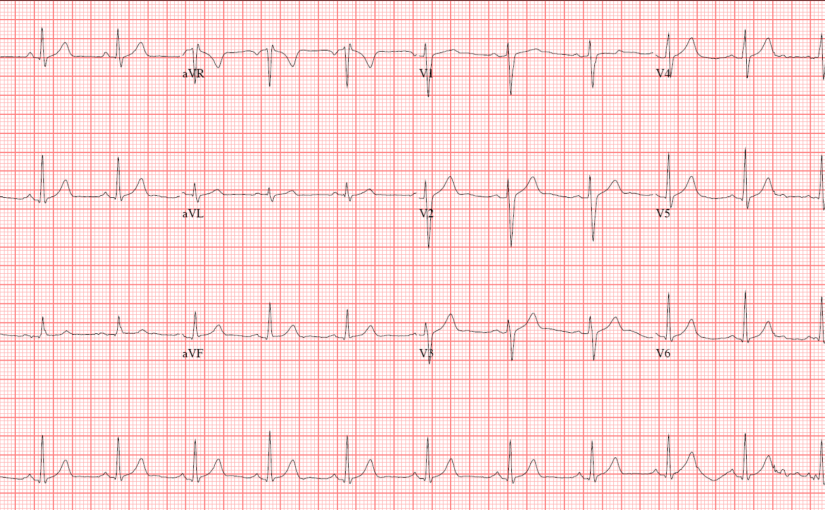
The Normal ECG

The normal ECG will display these characteristics:
- Rhythm
- <10% variation in RR intervals)
- Rate
- 60- 99bpm
- Cardiac Axis
- -30° – 90°
- P Waves
- 0.2-0.3mV
- 0.06 – 0.12s
- Upright in I, II, aVF, V2- V6
- Inverted in aVR
- Varies in III, aVLSinus origin
- PR Interval
- 0.12 – 0.2s
- Q Waves
- Small in I, II, aVL, V5, V6
- QRS Complex
- <0.12s
- ST Segment
- Isoelectric
- T Waves
- <2/3 height of preceding R wave
- 0.5mm in I, II, III
- <10mm in V1 – V6
- Same direction as preceding R wave
- <2/3 height of preceding R wave
- U Waves
- <25% of T wave
- Same direction as T wave
- QTc
- <440ms in males
- <460ms in females
Ref:
Andrade, J. ECG Guide by QxMD
Luthra, A. (2007) ECG Made Easy. Third edition. Tunbridge Wells: Anshan


To what extent do we do analysis of the graphical nature of these scans to identify deviations from the norm?
It seems to me that one could easily consider how the effectively 2-dimensional real analysis of these images might yield interesting and potentially useful results.
I’m not suggesting that this is new stuff: I imagine it’s already a well-populated and well-thought through field; I’m just interested to see how we already do such things.
LikeLike
Then you’ll be pleased to know that I’ve already compiled a page outlining some arrhythmias via analysis, Sinus Rhythms.
An ECG, is not the be all and end all of diagnosis in any respect, but is used as a precursor to other testing methods such as echocardiography. The trace can identify via physical measurement by the practitioner, the occlusion site of an artery in myocardial infarction and conduction abnormalities that would affect overall cardiac output.
As the leads presented measure the same snippet of electrical activity, it essentially gives a view a little closer to 3 dimensions that is displayed in a 2 dimensional form.
The more I add, the clearer it should become and it’ll be possible to see just how much an ECG can discern when measured.
I hope that answers your question.
LikeLiked by 1 person
It does, thanks!!
LikeLike